실행 후, http://127.0.0.1:8050/ 접속
- plot1.py
import dash
import dash_core_components as dcc
import dash_html_components as html
import plotly.graph_objs as go
import numpy as np

app = dash.Dash()

np.random.seed(42)
random_x = np.random.randint(1,101,100)
random_y = np.random.randint(1,101,100)

app.layout = html.Div([
    dcc.Graph(
        id='scatter3',
        figure={
            'data': [
                go.Scatter(
                    x = random_x,
                    y = random_y,
                    mode = 'markers',
                    marker = {
                        'size': 12,
                        'color': 'rgb(51,204,153)',
                        'symbol': 'pentagon',
                        'line': {'width': 2}
                        }
                )
            ],
            'layout': go.Layout(
                title = 'Random Data Scatterplot',
                xaxis = {'title': 'Some random x-values'},
                yaxis = {'title': 'Some random y-values'},
                hovermode='closest'
            )
        }
    )
])

if __name__ == '__main__':
    app.run_server()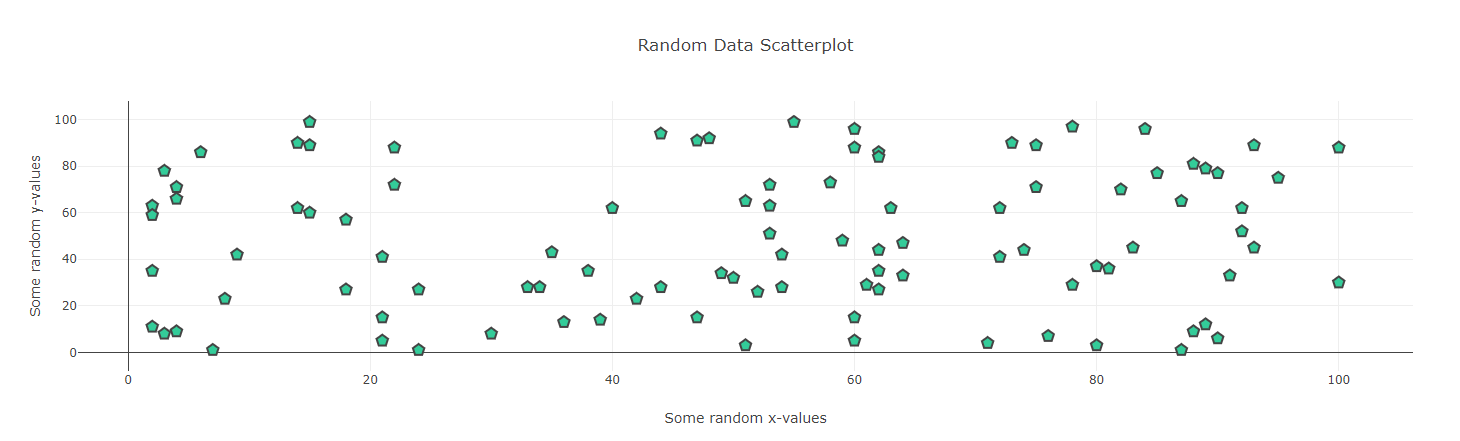
- plot2.py
import dash
import dash_core_components as dcc
import dash_html_components as html
import plotly.graph_objs as go
import numpy as np

app = dash.Dash()

# Creating DATA
np.random.seed(42)
random_x = np.random.randint(1,101,100)
random_y = np.random.randint(1,101,100)

app.layout = html.Div([dcc.Graph(id='scatterplot',
                    figure = {'data':[
                            go.Scatter(
                            x=random_x,
                            y=random_y,
                            mode='markers',
                            marker = {
                                'size':12,
                                'color': 'rgb(51,204,153)',
                                'symbol':'pentagon',
                                'line':{'width':2}
                            }
                            )],
                    'layout':go.Layout(title='My Scatterplot',
                                        xaxis = {'title':'Some X title'})}
                    ),
                    dcc.Graph(id='scatterplot2',
                                        figure = {'data':[
                                                go.Scatter(
                                                x=random_x,
                                                y=random_y,
                                                mode='markers',
                                                marker = {
                                                    'size':12,
                                                    'color': 'rgb(200,204,53)',
                                                    'symbol':'pentagon',
                                                    'line':{'width':2}
                                                }
                                                )],
                                        'layout':go.Layout(title='Second Plot',
                                                            xaxis = {'title':'Some X title'})}
                                        )])

if __name__ == '__main__':
    app.run_server()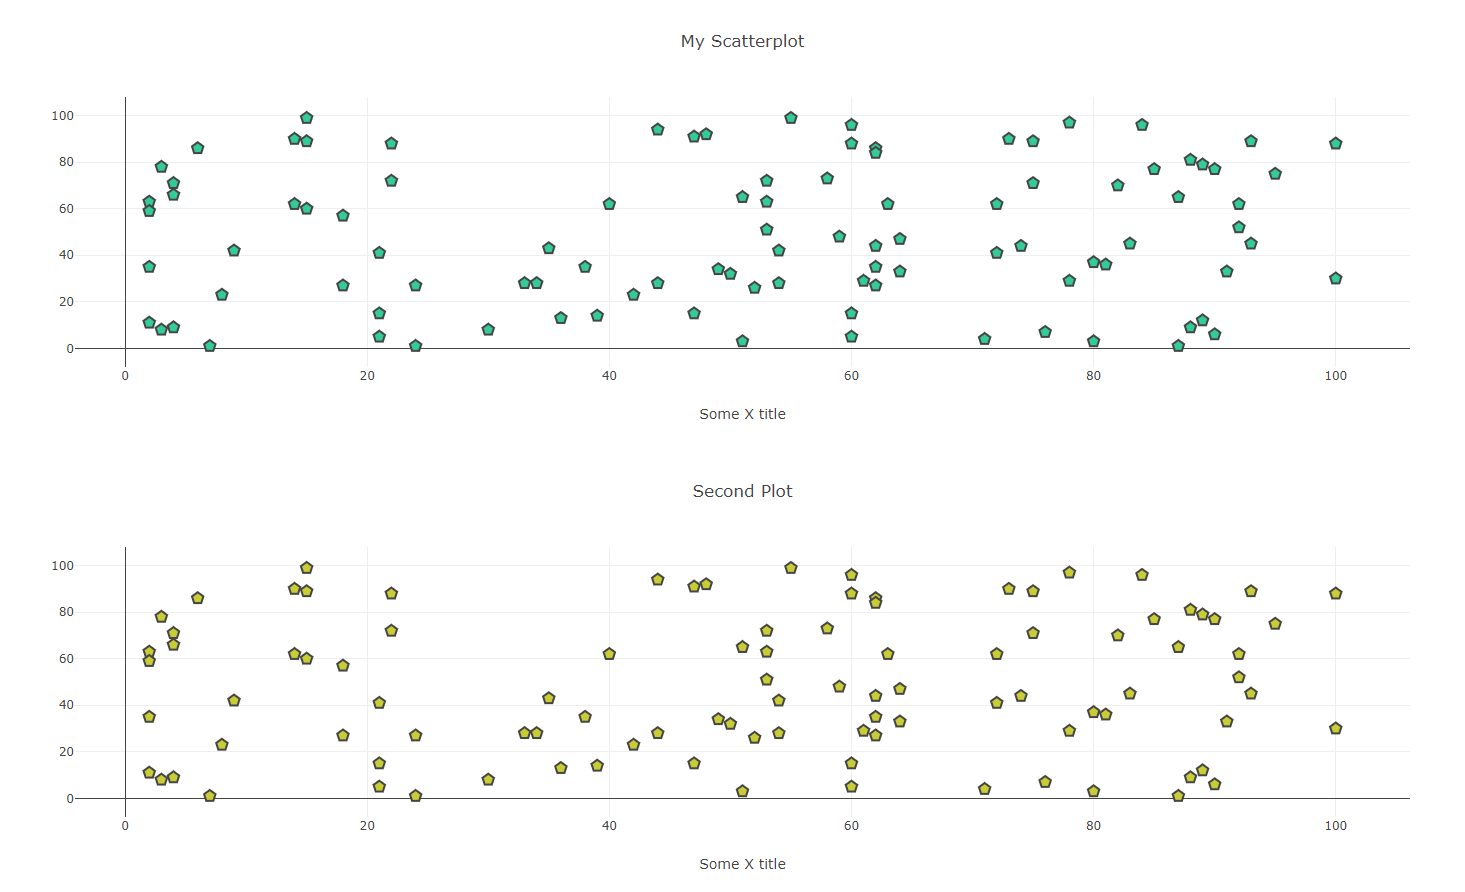
- Ex1-InteractiveComponents.py
import dash
import dash_core_components as dcc
import dash_html_components as html
from dash.dependencies import Input, Output


# Launch the application:

app = dash.Dash()

# Create a Dash layout that contains input components
# and at least one output. Assign IDs to each component:

app.layout=html.Div([
    dcc.RangeSlider(
        id='range-slider',
        min=-5,
        max=6,
        marks={i:str(i) for i in range(-5,7)},
        value=[-3,4]
        ),
    html.H1(id='product')
    ], style={'width':'50%'})


# Create a Dash callback:
@app.callback(
    Output('product', 'children'),
    [Input('range-slider', 'value')])

def update_value(value_list):
    return value_list[0]*value_list[1]


# Add the server clause:
if __name__ == '__main__':
   app.run_server()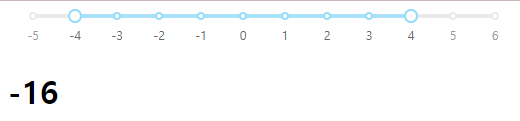
- Ex1-SimpleDashboard.py
import dash
import dash_core_components as dcc
import dash_html_components as html
import plotly.graph_objs as go
import pandas as pd

# Launch the application:
app = dash.Dash()

# Create a DataFrame from the .csv file:
df = pd.read_csv(r'OldFaithful.csv')

# Create a Dash layout that contains a Graph component:

app.layout=html.Div([
    dcc.Graph(
        id='Old_Faithful',
        figure={
            'data': [
                go.Scatter(
                    x = df['X'],
                    y = df['Y'],
                    mode = 'markers'
                )
            ],
            'layout': go.Layout(
                title = 'Old Faithful Eruption Intervals v Durations',
                xaxis = {'title': 'Duration of eruption (minutes)'},
                yaxis = {'title': 'Interval to next eruption (minutes)'},
                hovermode='closest'
            )
        }
    )
])


# Add the server clause:
if __name__ == '__main__':
    app.run_server()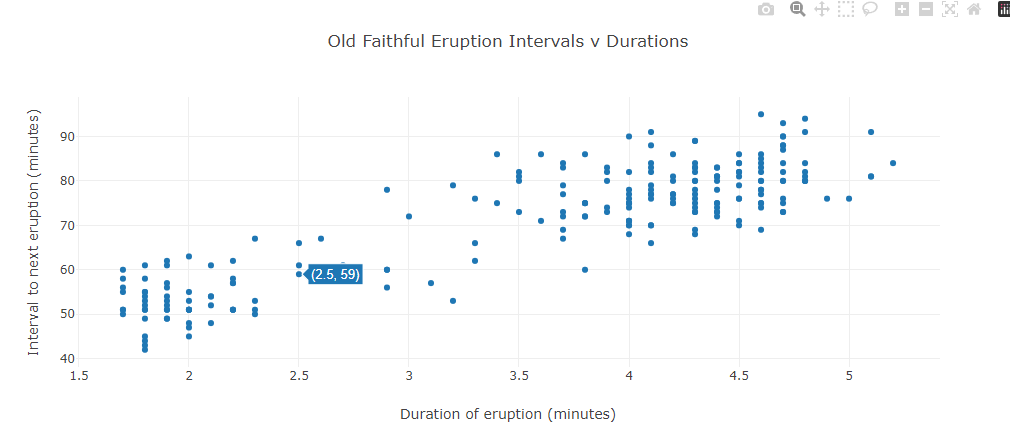
- markdown.py
import dash
import dash_core_components as dcc
import dash_html_components as html

app = dash.Dash()

markdown_text = '''
### Dash and Markdown

Dash apps can be written in Markdown.
Dash uses the [CommonMark](http://commonmark.org/) specification of Markdown.

Check out their [60 Second Markdown Tutorial](http://commonmark.org/help/)
if this is your first introduction to Markdown!

Markdown includes syntax for things like **bold text** and *italics*,
[links](http://commonmark.org/help), inline `code` snippets, lists,
quotes, and more.
'''

app.layout = html.Div([
    dcc.Markdown(children=markdown_text)
])

if __name__ == '__main__':
    app.run_server()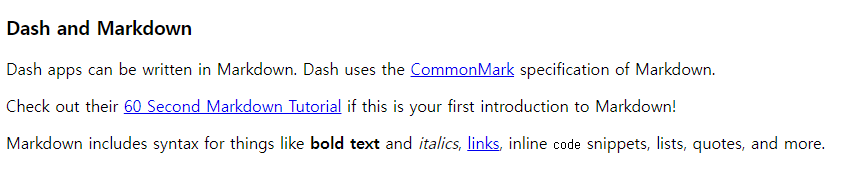
- CoreComponents.py
#######
# This provides examples of Dash Core Components.
# Feel free to add things to it that you find useful.
######
import dash
import dash_core_components as dcc
import dash_html_components as html

app = dash.Dash()

app.layout = html.Div([

    # DROPDOWN https://dash.plot.ly/dash-core-components/dropdown
    html.Label('Dropdown'),
    dcc.Dropdown(
        options=[
            {'label': 'New York City', 'value': 'NYC'},
            {'label': 'Montréal', 'value': 'MTL'},
            {'label': 'San Francisco', 'value': 'SF'}
        ],
        value='MTL'
    ),

    html.Label('Multi-Select Dropdown'),
    dcc.Dropdown(
        options=[
            {'label': 'New York City', 'value': 'NYC'},
            {'label': u'Montréal', 'value': 'MTL'},
            {'label': 'San Francisco', 'value': 'SF'}
        ],
        value=['MTL', 'SF'],
        multi=True
    ),

    # SLIDER https://dash.plot.ly/dash-core-components/slider
    html.Label('Slider'),
    html.P(
    dcc.Slider(
        min=-5,
        max=10,
        step=0.5,
        marks={i: i for i in range(-5,11)},
        value=-3
    )),

    # RADIO ITEMS https://dash.plot.ly/dash-core-components/radioitems
    html.Label('Radio Items'),
    dcc.RadioItems(
        options=[
            {'label': 'New York City', 'value': 'NYC'},
            {'label': 'Montréal', 'value': 'MTL'},
            {'label': 'San Francisco', 'value': 'SF'}
        ],
        value='MTL'
    )
], style={'width': '50%'})

if __name__ == '__main__':
    app.run_server()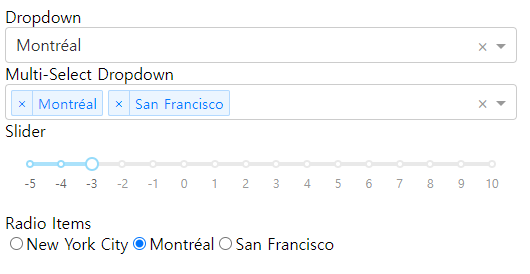
- HTMLComponents.py
import dash
import dash_html_components as html

app = dash.Dash()

app.layout = html.Div([
    'This is the outermost Div',
    html.Div(
        'This is an inner Div',
        style={'color':'blue', 'border':'2px blue solid', 'borderRadius':5,
        'padding':10, 'width':220}
    ),
    html.Div(
        'This is another inner Div',
        style={'color':'green', 'border':'2px green solid',
        'margin':10, 'width':220}
    ),
],
# this styles the outermost Div:
style={'width':500, 'height':200, 'color':'red', 'border':'2px red dotted'})

if __name__ == '__main__':
    app.run_server()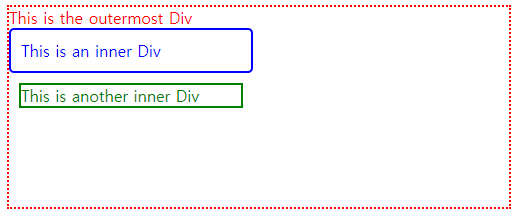
- callback1.py
import dash
import dash_core_components as dcc
import dash_html_components as html
from dash.dependencies import Input, Output

app = dash.Dash()

app.layout = html.Div([
    dcc.Input(id='my-id', value='초기 값', type='text'),
    html.Div(id='my-div')
])

@app.callback(
    Output(component_id='my-div', component_property='children'),
    [Input(component_id='my-id', component_property='value')]
)
def update_output_div(input_value):
    return '입력한 값 :  "{}"'.format(input_value)

if __name__ == '__main__':
    app.run_server()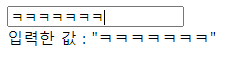
- callback2.py
import dash
import dash_core_components as dcc
import dash_html_components as html
from dash.dependencies import Input, Output
import plotly.graph_objs as go
import pandas as pd
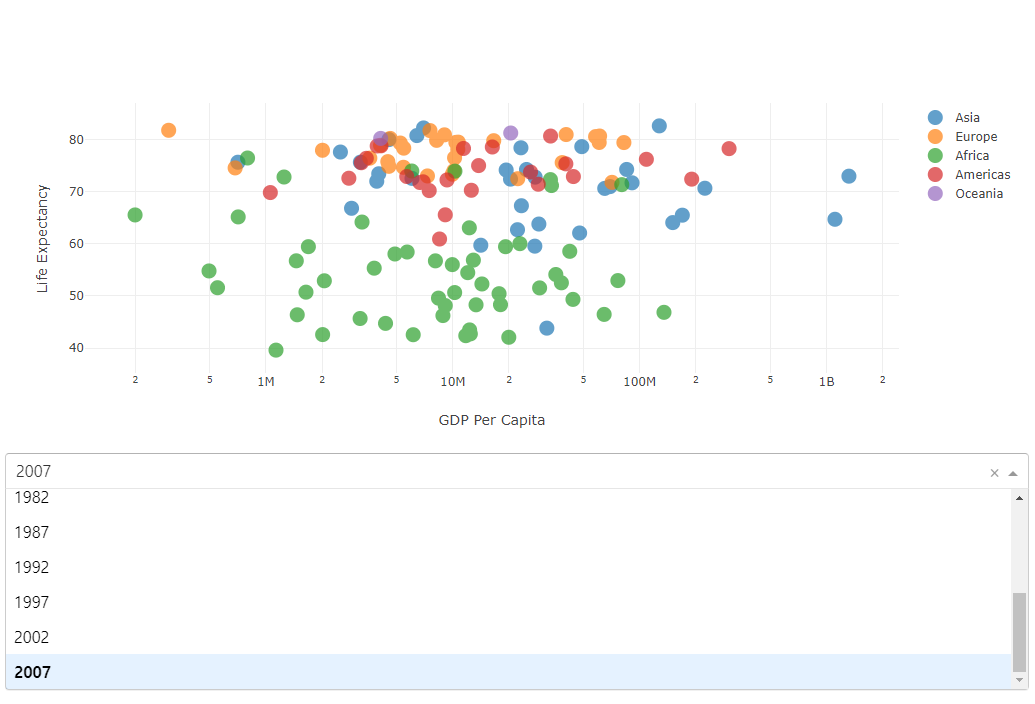
df = pd.read_csv(r'gapminderDataFiveYear.csv')
app = dash.Dash()
df.dtypes
# https://dash.plot.ly/dash-core-components/dropdown
# We need to construct a dictionary of dropdown values for the years
year_options = []
for year in df['year'].unique():
year_options.append({'label':str(year),'value':year})
# year_options
app.layout = html.Div([
dcc.Graph(id='graph'),
dcc.Dropdown(id='year-picker',options=year_options,value=df['year'].min())
])
@app.callback(Output('graph', 'figure'),
[Input('year-picker', 'value')])
def update_figure(selected_year):
filtered_df = df[df['year'] == selected_year]
traces = []
for continent_name in filtered_df['continent'].unique():
df_by_continent = filtered_df[filtered_df['continent'] == continent_name]
traces.append(go.Scatter(
x=df_by_continent['pop'],
y=df_by_continent['lifeExp'],
text=df_by_continent['country'],
mode='markers',
opacity=0.7,
marker={'size': 15},
name=continent_name
))
return {
'data': traces,
'layout': go.Layout(
xaxis={ 'type': 'log','title': 'GDP Per Capita'},
yaxis={'title': 'Life Expectancy'},
hovermode='closest'
)
}
if __name__ == '__main__':
app.run_server()hovermode : 마우스 포인터가 가리키는 부분에 데이터가 표시되는 것
- callback3.py
df = pd.read_csv(r'wheels.csv')

app.layout = html.Div([
    dcc.RadioItems(
        id='wheels',
        options=[{'label': i, 'value': i} for i in df['wheels'].unique()],
        value=1
    ),
    html.Div(id='wheels-output'),

    html.Hr(),  # add a horizontal rule
    dcc.RadioItems(
        id='colors',
        options=[{'label': i, 'value': i} for i in df['color'].unique()],
        value='blue'
    ),
    html.Div(id='colors-output')
], style={'fontFamily':'helvetica', 'fontSize':18})

@app.callback(
    Output('wheels-output', 'children'),
    [Input('wheels', 'value')])
def callback_a(wheels_value):
    return '선택한 번호는 "{}"입니다'.format(wheels_value)

@app.callback(
    Output('colors-output', 'children'),
    [Input('colors', 'value')])
def callback_b(colors_value):
    return '선택한 색은 "{}"입니다'.format(colors_value)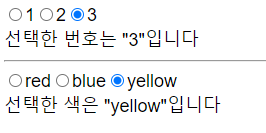
- callback5.py
import dash
import dash_core_components as dcc
import dash_html_components as html
from dash.dependencies import Input, Output
import pandas as pd
import base64
app = dash.Dash()
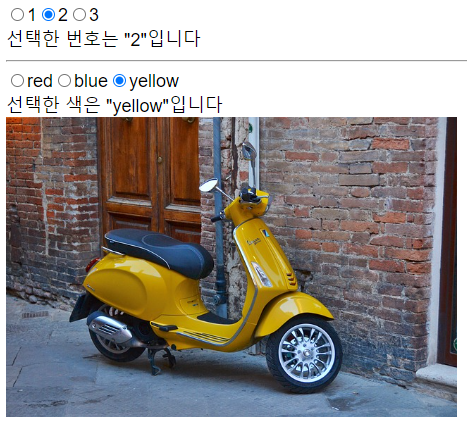
df = pd.read_csv(r'wheels.csv')
def encode_image(image_file):
encoded = base64.b64encode(open(image_file, 'rb').read())
return 'data:image/png;base64,{}'.format(encoded.decode())
app.layout = html.Div([
dcc.RadioItems(
id='wheels',
options=[{'label': i, 'value': i} for i in df['wheels'].unique()],
value=1
),
html.Div(id='wheels-output'),
html.Hr(), # add a horizontal rule
dcc.RadioItems(
id='colors',
options=[{'label': i, 'value': i} for i in df['color'].unique()],
value='blue'
),
html.Div(id='colors-output'),
html.Img(id='display-image', src='children', height=300)
], style={'fontFamily':'helvetica', 'fontSize':18})
@app.callback(
Output('wheels-output', 'children'),
[Input('wheels', 'value')])
def callback_a(wheels_value):
return '선택한 번호는 "{}"입니다'.format(wheels_value)
@app.callback(
Output('colors-output', 'children'),
[Input('colors', 'value')])
def callback_b(colors_value):
return '선택한 색은 "{}"입니다'.format(colors_value)
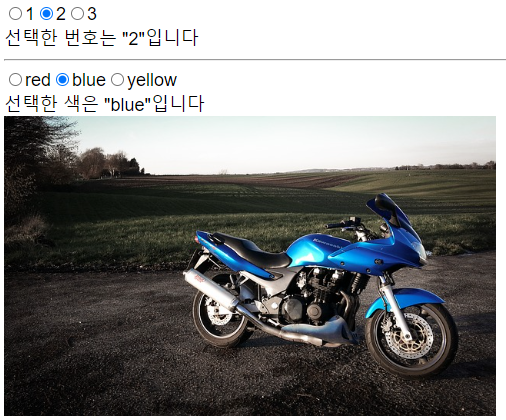
@app.callback(
Output('display-image', 'src'),
[Input('wheels', 'value'),
Input('colors', 'value')])
def callback_image(wheel, color):
path = 'images/'
return encode_image(path+df[(df['wheels']==wheel) & \
(df['color']==color)]['image'].values[0])
if __name__ == '__main__':
app.run_server()encoded = base64.b64encode(open(image_file, 'rb').read()) : 이미지를 Text로 바꾸는 Encoding
- callback6.py
import dash
import dash_core_components as dcc
import dash_html_components as html
from dash.dependencies import Input, Output

app = dash.Dash()

app.layout = html.Div([
    dcc.Input(
        id='number-in',
        value=1,
        style={'fontSize':28}
    ),
    html.H1(id='number-out')
])

@app.callback(
    Output('number-out', 'children'),
    [Input('number-in', 'value')])
def output(number):
    return number

if __name__ == '__main__':
    app.run_server()
- callback6.py
app.layout = html.Div([
    dcc.Input(
        id='number-in',
        value=1,
        style={'fontSize':28}
    ),
    html.Button(
        id='submit-button',
        n_clicks=0,
        children='Submit',
        style={'fontSize':28}
    ),
    html.H1(id='number-out')
])

@app.callback(
    Output('number-out', 'children'),
    [Input('submit-button', 'n_clicks')],
    [State('number-in', 'value')])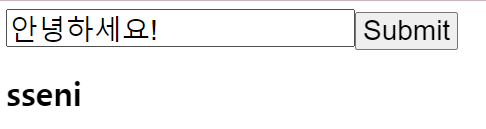
- callback6b.py
app.layout = html.Div([
    dcc.Input(
        id='number-in',
        value=1,
        style={'fontSize':28}
    ),
    html.Button(
        id='submit-button',
        n_clicks=0,
        children='Submit',
        style={'fontSize':28}
    ),
    html.H1(id='number-out')
])

@app.callback(
    Output('number-out', 'children'),
    [Input('submit-button', 'n_clicks')],
    [State('number-in', 'value')])
def output(n_clicks, number):
    return '{} displayed after {} clicks'.format(number,n_clicks)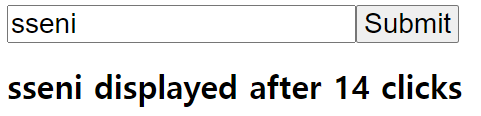
- callbacksXX.py
#######
# This is Dash's tutorial script for multiple inputs
# using Chris Parmer's indicators.csv dataset
######
import dash
import dash_core_components as dcc
import dash_html_components as html
from dash.dependencies import Input, Output
import plotly.graph_objs as go
import pandas as pd
app = dash.Dash()
df = pd.read_csv(
'https://gist.githubusercontent.com/chriddyp/'
'cb5392c35661370d95f300086accea51/raw/'
'8e0768211f6b747c0db42a9ce9a0937dafcbd8b2/'
'indicators.csv')
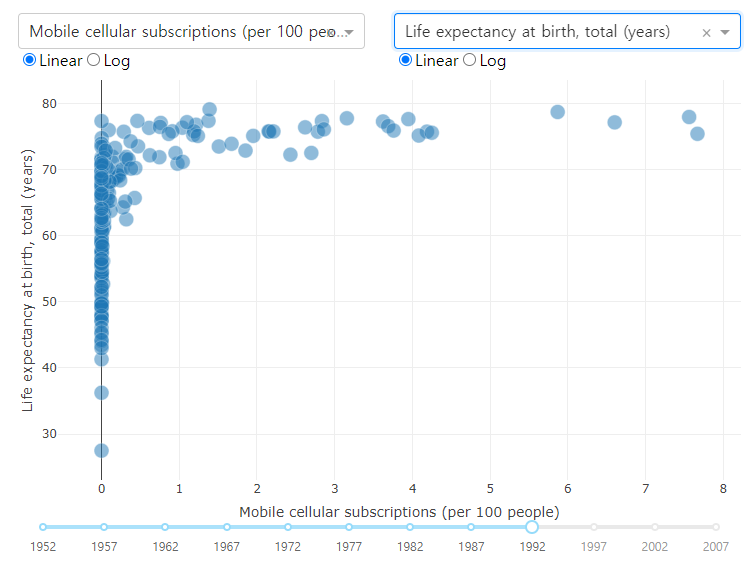
available_indicators = df['Indicator Name'].unique()
app.layout = html.Div([
html.Div([
html.Div([
dcc.Dropdown(
id='xaxis-column',
options=[{'label': i, 'value': i} for i in available_indicators],
value='Fertility rate, total (births per woman)'
),
dcc.RadioItems(
id='xaxis-type',
options=[{'label': i, 'value': i} for i in ['Linear', 'Log']],
value='Linear',
labelStyle={'display': 'inline-block'}
)
],
style={'width': '48%', 'display': 'inline-block'}),
html.Div([
dcc.Dropdown(
id='yaxis-column',
options=[{'label': i, 'value': i} for i in available_indicators],
value='Life expectancy at birth, total (years)'
),
dcc.RadioItems(
id='yaxis-type',
options=[{'label': i, 'value': i} for i in ['Linear', 'Log']],
value='Linear',
labelStyle={'display': 'inline-block'}
)
],style={'width': '48%', 'float': 'right', 'display': 'inline-block'})
]),
dcc.Graph(id='indicator-graphic'),
dcc.Slider(
id='year--slider',
min=df['Year'].min(),
max=df['Year'].max(),
value=df['Year'].max(),
step=None,
marks={str(year): str(year) for year in df['Year'].unique()}
)
], style={'padding':10})
@app.callback(
Output('indicator-graphic', 'figure'),
[Input('xaxis-column', 'value'),
Input('yaxis-column', 'value'),
Input('xaxis-type', 'value'),
Input('yaxis-type', 'value'),
Input('year--slider', 'value')])
def update_graph(xaxis_column_name, yaxis_column_name,
xaxis_type, yaxis_type,
year_value):
dff = df[df['Year'] == year_value]
return {
'data': [go.Scatter(
x=dff[dff['Indicator Name'] == xaxis_column_name]['Value'],
y=dff[dff['Indicator Name'] == yaxis_column_name]['Value'],
text=dff[dff['Indicator Name'] == yaxis_column_name]['Country Name'],
mode='markers',
marker={
'size': 15,
'opacity': 0.5,
'line': {'width': 0.5, 'color': 'white'}
}
)],
'layout': go.Layout(
xaxis={
'title': xaxis_column_name,
'type': 'linear' if xaxis_type == 'Linear' else 'log'
},
yaxis={
'title': yaxis_column_name,
'type': 'linear' if yaxis_type == 'Linear' else 'log'
},
margin={'l': 40, 'b': 40, 't': 10, 'r': 0},
hovermode='closest'
)
}
if __name__ == '__main__':
app.run_server()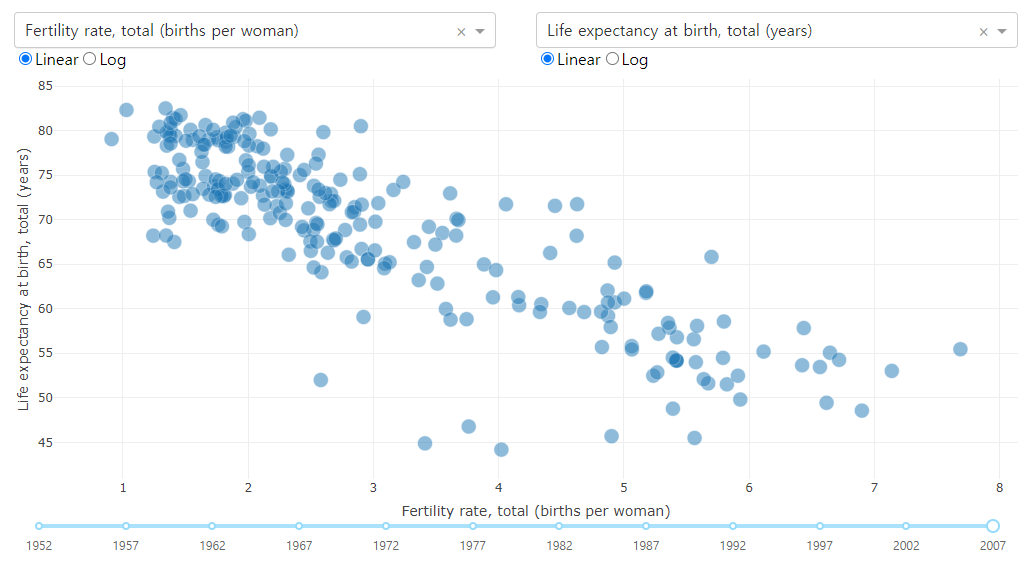
300x250