- x.argmin() : 몇번째 값이 최솟값인지 인덱스를 반환
# pandas
- import, read, display data
- dataframe, table
- [] : list
- () : tuple
- { } : set, 중복이 없음
- { : } : dic
- df.T : 전치
[실습] - Pandas
import matplotlib.pyplot as plt
import numpy as np

def f(t):
    return np.exp(-t) * np.cos(2*np.pi*t)

t1 = np.arange(0.0, 5.0, 0.1)
t2 = np.arange(0.0, 5.0, 0.02)

plt.figure(1)
# The subplot() command specifies numrows, numcols, subplot(행의수,열의수, 현재 그림 위치)
# fignum where fignum ranges from 1 to numrows*numcols.
plt.subplot(221)
plt.grid()
plt.plot(t1, f(t1), 'b-')

plt.subplot(224)
plt.plot(t2, np.cos(2*np.pi*t2), 'r--')
plt.show()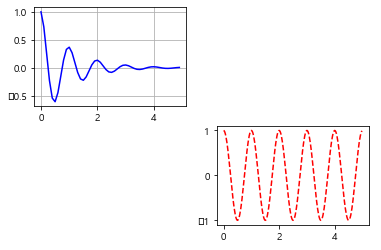
plt.plot(x, np.sin(x-0), color = 'black') # Specify colour by name

plt.plot(x, np.sin(x-1), color = 'g') # short color code(rgbcmyk)
plt.plot(x, np.sin(x-2), color = '0.75') # Grayscale between 0 and 1
plt.plot(x, np.sin(x-3), color = '#FFDD44')  # Hex code (RRGGBB from 00 to FF)
plt.plot(x, np.sin(x-4), color = (1.0,0.2,0.3)) # Rgb tuple , value 0 and 1
plt.plot(x, np.sin(x-5), color = 'chartreuse') #all HTML color names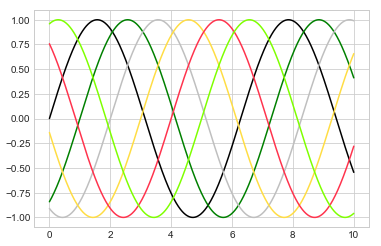
rng = np.random.RandomState(0)
x = rng.randn(100)
y = rng.randn(100)
colors = rng.rand(100)
size = 1000*rng.rand(100)

plt.scatter(x,y, c=colors,s=size,alpha=0.3,
           cmap='viridis')
plt.colorbar();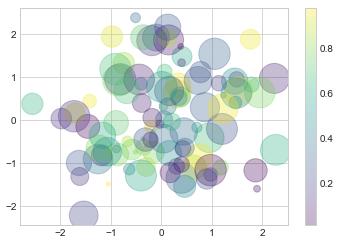
from sklearn.datasets import load_iris
iris = load_iris()
features = iris.data.T

plt.scatter(features[0], features[1],alpha=0.2,
           s=100*features[3], c=iris.target, cmap='viridis')
plt.xlabel(iris.feature_names[0])
plt.ylabel(iris.feature_names[1]);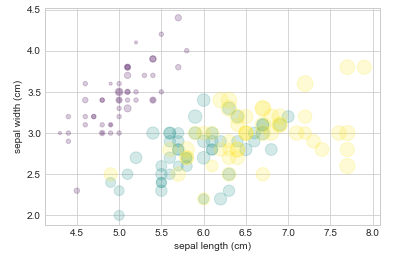
- randn : 표준 정규분포
# In multiple subplot we can plot a two or more plot in a single plot
%matplotlib inline
import matplotlib.pyplot as plt
plt.style.use('seaborn-whitegrid')
import numpy as np

ax1 = plt.axes()
ax2 = plt.axes([0.65, 0.65,0.2,0.2])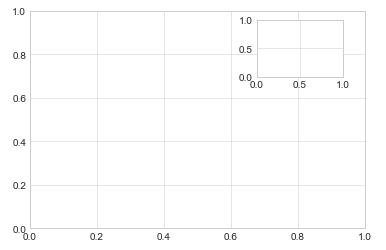
plt.subplot(grid[0, 0])
plt.subplot(grid[0, 1:])
plt.subplot(grid[1, :2])
plt.subplot(grid[1, 2])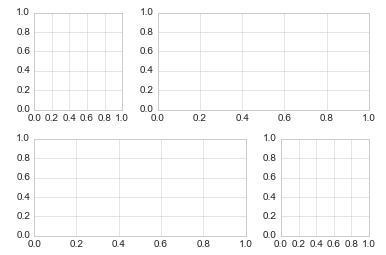
>> 다음주에 seaborn
300x250